Truckometer - March YoYo
Posted: 11-Apr-2025 |
The Light Traffic Index (LTI) continues to bounce around a fairly flat trend, up 0.1% in March and down 0.4% y/y. The more volatile Heavy Traffic Index (HTI) fell 2.1%, to be up 2.3% y/y.
Light traffic (motorbikes, cars and vans) is generally a good indicator of the state of demand, as opposed to production. It typically provides a six-month lead on momentum in the economy, and variation reflects discretionary spending on outings, movement of couriers and tradespeople etc.
The trend in light traffic is mildly upward. In per capita terms (calculated using ANZ population forecasts), light traffic has flattened out after a sharp drop, like GDP.
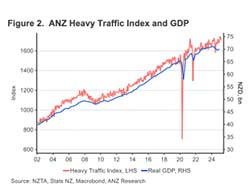
Heavy traffic data (mostly trucks) tends to provide a good steer on production GDP in real time, as it captures both goods production and freight associated with both wholesale and retail trade.
The HTI fell 2.1% in March (figure 2) but is still up 2.3% compared to a year ago (three-month average). The per capita HTI has bounced back after a sharp fall in the middle of last year.
Search Articles
Search Trucks Database
NZ Truck & Driver Magazine
Read Now


 + EQUIPMENT GUIDE - FREE